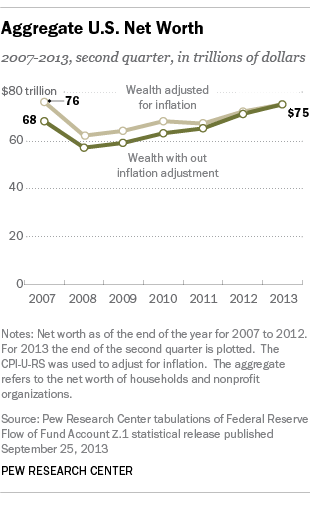
At first glance, new data released Wednesday from the Federal Reserve appears to show an increase in the nation’s net worth compared with six years ago, when the stock market plunged and the financial sector was on the brink of collapse. The Fed reported that the nation’s net worth is $74.8 trillion as of June 30, compared with $67.8 trillion in 2007. Does that mean the wealth of a typical U.S. household has fully recovered from the Great Recession? Hardly. Keep in mind 3 considerations:

The Fed’s aggregate net worth figures are reported in each year’s dollars and do not account for price inflation. Although the details depend on the particular price index used, prices have gone up about 13% from 2007 to June 2013. If we put everything in 2013 dollars, net worth amounted to $74.8 trillion as of June 30, 2013. In 2013 dollars, 2007 net worth amounted to $76.5 trillion. So taking inflation into account, aggregate wealth remains about 98% of its 2007 pre-recession peak.

Keep in mind that the Fed’s aggregate net worth is compiled for the nation’s households and nonprofit organizations, and it’s useful to take into account how their totals have changed during the past six years. We know that the number of households has increased since 2007, from 111.7 million in 2007 to 114.7 million as of the second quarter of 2013, according to the Census Bureau.
Using these household estimates, real net worth per household was $684,662 in 2007. Accounting for inflation and household growth, real net worth per household stands at $652,449 as of June 30, 2013, or about 95% of its 2007 level. Admittedly, these are only suggestive estimates. And, to be fair, it’s unclear from the Fed’s aggregate data what portion the nonprofits comprise.

Even if real net worth per household had recovered to its 2007 level, it is very likely that a large swath of households has not recovered. Prior Pew Research indicates that all of the gains in wealth since 2009 have accrued to the nation’s wealthier households (households with a net worth of at least $500,000).
Wealth is not evenly distributed. The Fed’s 2010 Survey of Consumer Finances revealed that the wealthiest 10% of American households own 75% of aggregate wealth. So, a minority of households have large amounts of wealth and many households have modest amounts of wealth. How modest? The 2010 survey indicates that half of American households have no more than $83,000 in net worth.
For the majority of American households, most of their net worth is in their home. Nationally, housing prices are nowhere near their 2007 levels (let alone their 2006 peak). The S&P/Case-Shiller home price index is still down 14% from its 2007 level. Granted, home equity is a slightly different animal than home value (home equity= home value – mortgages), but typical home equity levels are likely substantially below their 2007 levels.

The Fed’s release does shed light on the recovery in home equity. The Fed reported that owners’ equity in real estate was $9.3 trillion as of June 30, 2013. In 2007, homeowners equity totaled $11.4 trillion (in 2013 dollars). So total home equity remains 82% of its 2007 level.
Until the housing market and home equity levels fully recover, the typical American household still has a ways to go.