With the unemployment rate down to 5.6% as of December (the lowest since mid-2008), Americans are at long last feeling better about the economy. According to a new Pew Research Center report, 27% of U.S. adults say economic conditions are excellent or good, about twice the percentage who said that at the beginning of 2014. 31% expect the economy to be better a year from now, versus 17% who expect it to be worse, and for the first time in five years, more Americans say President Obama’s economic policies have made conditions better (38%) than worse (28%).
With Obama likely to discuss the improving economy in his State of the Union address next week, we decided to compare the latest payroll figures with the data from January 2009, to get a sense of how the nation’s employment structure has changed since Obama took office.
The takeaway: An overall gain of 6.4 million more non-farm payroll jobs last month than in January 2009, which represents a 4.8% increase. All of that growth came from the private sector, while the public sector shrunk: Private payrolls have added 7 million jobs over Obama’s presidency, while government payrolls (federal, state and local) have contracted by a combined 634,000 jobs.
Specifically, it’s the service sector that’s been generating jobs — nearly 7.6 million new ones since January 2009. But more than half of those jobs are in just three sectors:
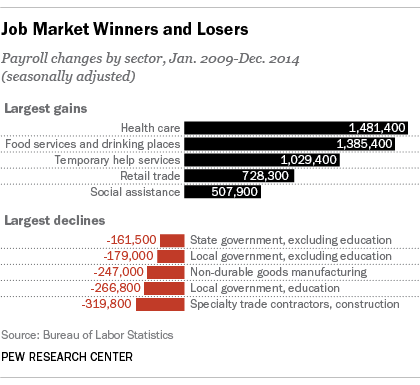
- Nearly 1.5 million jobs were created in the healthcare sector, which now accounts for 11.1% of all payroll jobs in the country (up from 10% at the start of 2009). That continues a trend of steady growth that dates back to at least 1990, well before the Affordable Care Act: Healthcare now employs 14.9 million Americans, versus about 13.4 million six years ago — an 11% growth rate over that period.
- Bars, restaurants and other food-service employers have added almost 1.4 million jobs since the start of Obama’s presidency, for total growth of 14.6%. More than 10.8 million people now work in that industry, 7.7% of all payroll jobs.
- More than a million of the newly created jobs are at temporary-help agencies, which now account for 2% of all payroll jobs in the country. The industry’s total employment was just under 3 million in December, versus 1.96 million at the start of 2009 — an overall 52.5% growth rate.
A handful of thriving goods-producing industries have gotten a lot of attention, but they don’t employ all that many people. Payrolls of oil and gas producers, for instance, have jumped nearly 31%, reflecting the surge in domestic production; still, that’s just 216,100 jobs in total. And automakers, who benefited from massive government aid during the depths of the Great Recession, have added 192,700 jobs (28%) since January 2009; they now employ 884,000 people.
However, autos were among the few manufacturers to buck that sector’s downward trend. Overall, manufacturing is 321,000 payroll jobs below where it was when Obama took office (although the sector has added 786,000 jobs since bottoming out in early 2010).
Construction, another goods-producing sector, is still down 401,000 jobs from where it stood at the start of 2009 — which, in turn, was 15% below its peak payroll in April 2006, shortly before the air began leaking out of the housing bubble. Construction continued to shed jobs well into Obama’s first term, bottoming out in January 2011; the sector’s growth since then, while a relatively robust 13.5%, has only been enough to bring payrolls back to where they were in the spring of 2009.
Government payrolls at nearly all levels also have been cut. Local governments have shed 446,000 jobs, about 3% of their total workforce; state governments have cut a net 121,000 jobs, with small growth in education more than offset by cuts elsewhere. And while the federal government has added 62,700 non-postal jobs, the Postal Service has reduced its workforce nearly 18%, or 129,400 jobs. The Postal Service now employs fewer than 600,000 people, its smallest payroll since 1964.