One of the characteristics of the modern wave of Asian immigration to the United States is that it has gathered momentum in an era when the biggest sending countries have experienced dramatic economic growth and standard of living gains. Yet the Pew Research survey finds few Asian immigrants looking back over their shoulders with regret. A large majority (76%) say that if they had to do it all over again, they would still come to the U.S.; just 12% say they would stay in their home country and 6% say they would move somewhere else.
Many Asian Americans—both foreign born and native born—acknowledge the growing economic power of China and other Asian countries in relation to the U.S., but they overwhelmingly favor the U.S. over their country of origin on a wide range of measures. Among them is the “opportunity to get ahead”; fully 73% rate the U.S. better on this question, while just 5% rate their own country of origin better. By margins nearly as lopsided, Asian Americans also see the U.S. as offering more political and religious freedoms, providing better conditions for raising children, and doing a better job of caring for the poor.
On a question about which country has better moral values, survey respondents are evenly divided. The only measure on which they give the nod to their country of origin over the U.S. is “strength of family ties”—not surprising in light of the fact that 74% of Asian-American adults are themselves immigrants. Also, 59% of all Asian Americans report that they have immediate family residing in their country of origin, and 33% say they sent money to people living abroad in the past year.
Asian Americans born in the U.S. are even more likely than their foreign-born counterparts to rate the U.S. highly in terms of the opportunity it offers to get ahead; its guarantees of political and religious freedoms; and the conditions it provides for raising children. At the same time, the foreign born rank the U.S. more highly in its moral values and its treatment of the poor.
This chapter explores why Asian-American immigrants came to the U.S. and how they feel, in retrospect, about their decision to migrate. It looks at the share of respondents who still have close family living in their country of origin, and the share that sends money to family or friends in their country of origin. And it examines perceptions of how the U.S. compares with the respondent’s country of origin across a number of realms, as well as attitudes regarding whether immigrants strengthen or burden the U.S.
Coming to the U.S.
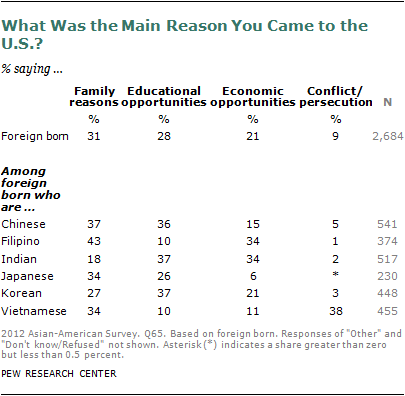
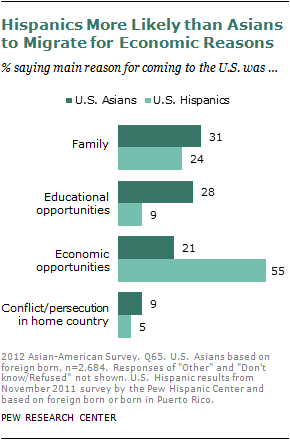
While the decision to migrate is often fueled by a complex mix of motivations, when immigrant respondents were asked to name the main reason that they came to the U.S., some 31% say they came for family reasons, including family reunification. An additional 28% report that educational opportunity was their main reason for coming, and about one-fifth (21%) say it was economic opportunity. Smaller shares report migrating primarily to escape persecution (9%) or for some other reason (9%).
Women are far more likely than men to report coming to the U.S. for family reasons (40% vs. 22%), likely due to the fact that many women are migrating to reunite with family members already in the U.S. Men are more likely than women to report immigrating to the U.S. for economic reasons (26% vs. 17%) or educational reasons (31% vs. 25%).
Those most likely to say that they migrated for educational reasons are younger and better educated. Some 37% of respondents ages 18 to 34 say so, as do 38% of those with a college degree or more. This is not surprising, considering that those who migrate for educational purposes typically come for college, graduate school or professional school. And the relatively youthful profile of these educational migrants likely reflects that many are still in the midst of their academic training in the U.S.
Filipino immigrants are among the most likely to say they came to the U.S. primarily for family reasons (43%), while Indian immigrants are the least likely to say this (18%). About one-third of Chinese immigrants (36%), Indian immigrants (37%) and Korean immigrants (37%) report that they migrated primarily for educational reasons, but only about one-tenth of Vietnamese immigrants (10%) and Filipino immigrants (10%) say so. Economic opportunity was the primary motivator for about one-third of Indian and Filipino immigrants (34% each), but it was important to only a handful of Japanese immigrants (6%). Among the Vietnamese, 38% cite the desire to escape persecution in their home country as the primary reason for migration.
A Pew Research Center survey conducted last year asked Hispanics a similar question. While family, education and economic opportunity all figured prominently in the reasons Asians migrated to the U.S., among Hispanic immigrants, the primary reason for migration was unequivocally economic. In the 2011 survey, more than half (55%) of Hispanic immigrants said as much. Only 9% of Hispanic immigrants came for educational reasons, compared with 28% of Asian-American immigrants. The share of Hispanics who migrated for family reasons (24%) was slightly lower than that among Asian-American immigrants. And 5% of Hispanic immigrants came to escape persecution or conflict in their home country.
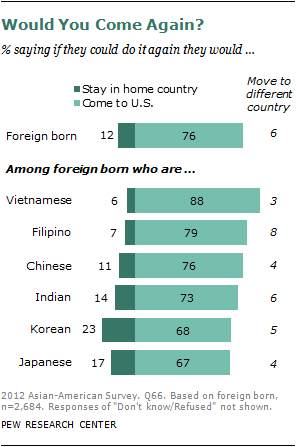
While their reasons for coming to the U.S. in the first place vary, a large majority of Asian- American immigrants share the same attitude about their migration—if they had to do it again, three-fourths (76%) would still come to the U.S. Some 12% report that they would have stayed in their home country, and 6% would have moved to another country.
Vietnamese immigrants are the most likely to say they would still move to the U.S. if they had to do it again, with 88% reporting so. At the other end of the spectrum, some 68% of Korean immigrants and 67% of Japanese immigrants report as much. Notable shares also report that they would have stayed in their home country (23% of Korean immigrants, 17% of Japanese immigrants).
Like Asian-American immigrants, Hispanic immigrants in the U.S. are extremely likely to report that, were they to do it all over again, they would still choose to migrate to the U.S. Some 79% say so, compared with 76% of Asian-American immigrants.
These results should be interpreted cautiously—since the survey was conducted only among those currently living in the U.S., it excludes past Asian immigrants who have chosen to return to their country of origin. However, return migration is estimated to be lower for Asians than for other immigrants, and the naturalization rate—that is, the share of eligible immigrants who become U.S. citizens—is relatively high. For more details see Chapter 1.
Ties to the Country of Origin
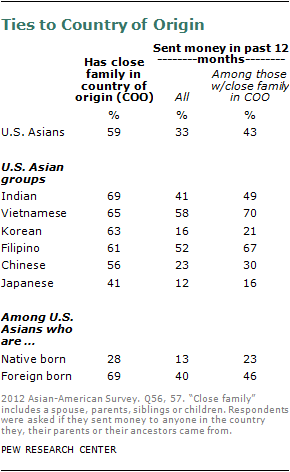
Large shares of all Asian Americans still have close family ties in their country of origin. Some 59% report that they have a spouse, children, parents or siblings residing in their country of origin. The foreign born are much more likely to say this—69% versus 28% for the native born.
Among all Asian Americans, at least 60% of Indian Americans (69%), Vietnamese Americans (65%), Korean Americans (63%) and Filipino Americans (61%) still have close family living in their country of origin. Just over half (56%) of Chinese Americans have immediate family still in China, Taiwan or another country of origin. Japanese Americans, the majority of whom were born in the U.S., are least likely to have close relatives in their country of origin, but a sizable minority—41%—do.
Remittances, which are transfers of money sent back to the country of origin, are one way in which families remain linked transnationally. Overall, one-third (33%) of Asian Americans report sending remittances to anyone in their country of origin in the past year,66 and among those Asian Americans who report having immediate family members still living in the country of origin, this share rises to 43%. Among the foreign born, 40% of all respondents, and 46% of respondents with close family living in their home country, remitted in the past year. In comparison, 13% of native-born respondents, and about one-fourth (23%) of native-born respondents with close family in the home country, did the same.
Vietnamese Americans with close family still in Vietnam are very likely to remit, with 70% reporting that they sent money in the past year. Filipino Americans are among the most likely to report moving to the U.S. for economic reasons, and the majority (67%) who still have close relatives in the Philippines also report remitting money. Sending remittances is less prevalent among members of other Asian subgroups. Just 21% of Korean Americans with close family in the country of origin sent money in the past year, and 16% of comparable Japanese Americans did the same.
Comparing Conditions in the U.S. to Those in the Country of Origin
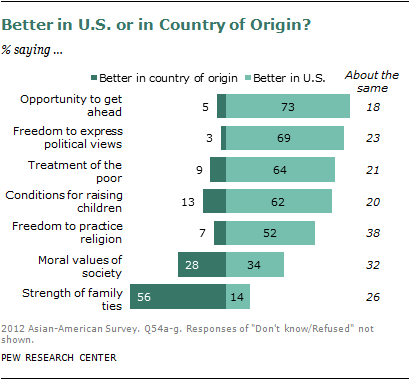
The survey asked a series of questions regarding whether certain conditions are better in the U.S. or in the respondent’s country of origin.67 On most of these measures, the U.S. fares quite well in comparison to the country of origin. This is particularly so in terms of the opportunity to get ahead. The U.S. also ranks well in terms of political freedoms. In terms of moral values, sizable shares of respondents favor both the U.S. and their country of origin. When it comes to the strength of family ties, a majority of respondents favor their country of origin, and only one-in-seven (14%) perceives family ties as stronger in the U.S.
Given the very different profiles of the countries of origin, and the different histories of the migration streams from those countries, it’s no surprise that there are variations in the relative ratings of the U.S. among people from different countries of origin. For example, the Vietnamese Americans—many of whom came as refugees from a country gripped by conflict—rate the U.S. quite highly compared with Vietnam. In contrast, Filipino Americans, many of whom are fairly well educated and who came to the U.S. for economic advancement, are less likely to state that the U.S. is better than the Philippines on these measures.
The native born are more likely than the foreign born to regard the opportunity to get ahead as better in the U.S. than in their families’ country of origin. They also perceive the U.S. as offering more political and religious freedoms. By contrast, the foreign born are more likely than their native-born counterparts to see the U.S. as offering better moral values and better treatment of the poor.
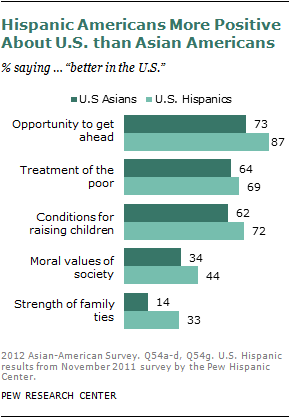
Comparing results to a 2011 Pew Hispanic Center survey reveals that Hispanic Americans are more likely than Asian Americans to rate the U.S. higher than their country of origin on all comparable measures. This is true in terms of the opportunity to get ahead, moral values, strength of family ties, conditions for raising children and treatment of the poor.
Economic Opportunity
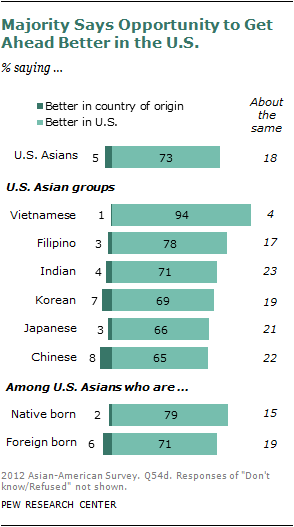
When it comes to getting ahead economically, almost three-fourths (73%) of Asian Americans state that the U.S. offers better opportunities than their country of origin. An additional 18% state that the economic opportunities are similar in both places, while only 5% perceive better opportunities in their country of origin.
The majority of respondents from each Asian- American subgroup say that the U.S. offers more opportunities to get ahead than their country of origin. The prevalence of this opinion varies somewhat within these groups, from 94% of Vietnamese Americans who agree with the statement to about two-thirds of Korean Americans (69%), Japanese Americans (66%) and Chinese Americans (65%) who agree with it. About one-fifth of respondents in each of these groups say that opportunities are similar in the U.S. and their country of origin.
Native-born respondents are somewhat more likely than the foreign born to perceive more opportunities in the U.S. than in their country of origin. Some 79% of Asian Americans born in the U.S. agree, compared with 71% of Asian Americans born outside of the U.S. This pattern is particularly notable among Chinese Americans; while 82% of the native born agree with this statement, the share drops to 61% among the foreign born. Significant nativity differences exist among Korean Americans (84% vs. 66%) and Indian Americans (86% vs. 70%) as well.
U.S. Hispanics are even more positive than their Asian-American counterparts about the opportunity to get ahead in the U.S. While some 73% of Asian Americans state that the opportunities to get ahead are better in the U.S. than in their country of origin, among Hispanics this share jumps to 87%. One-in-ten (10%) Latinos say the opportunity to get ahead is similar in both places, compared with 18% of Asian Americans.
Political and Religious Freedoms
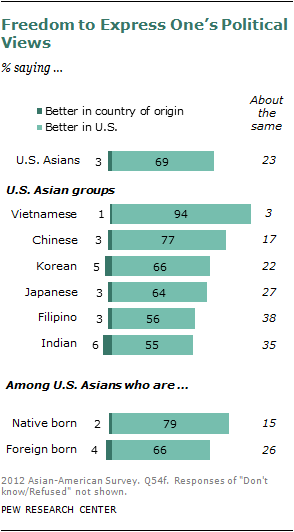
Asian Americans also rate the U.S. higher than their countries of origin in terms of providing freedoms to express political opinions. Almost seven-in-ten (69%) state that the U.S. offers a better environment for this than does their country of origin. An additional 23% state that the ability to express political views is similar in the U.S. and their country of origin. Just 3% say that freedom to express political views is better in their country of origin.
Vietnamese Americans are by far the most likely to state that the U.S. offers more political freedoms than their country of origin; fully 94% say as much. This is no great surprise given that many came to the U.S. as political refugees. At the other end of the spectrum are Indian Americans; some 55% think that political freedoms are better in the U.S. than in India, and 35% think that political freedoms in the two countries are similar. Filipino Americans have a comparable perspective—56% think the U.S. offers more political freedoms than their country of origin, and 38% think political freedoms are similar in the U.S. and the Philippines.
Native-born Asian Americans are more likely than the foreign born to believe that the U.S. offers more freedom to voice political opinions (79% vs. 66%) than their country of origin. Conversely, the foreign born are more likely to believe that political freedoms are similar in both places (26% say so, compared with 15% among the native born). In the case of Japanese Americans and Filipino Americans, nativity differences are especially pronounced; three-fourths (75%) of native-born Japanese Americans and Filipino Americans agree that political freedoms are better in the U.S. than their country of origin, compared with about half (49%) of the foreign born in each of these groups. Among Chinese Americans, including those from Taiwan and other places, 85% of the native born and 75% of the foreign born say political freedoms are better in the U.S. than their country of origin. Other U.S. Asian groups do not have a large enough sample of native-born respondents for analysis.
In terms of religious—as opposed to political—freedom, Asian Americans are a bit less likely to see the U.S. as offering liberties beyond those of their country of origin, though about half (52%) do. Some 38% perceive religious freedom to be similar in their country of origin and in the U.S.
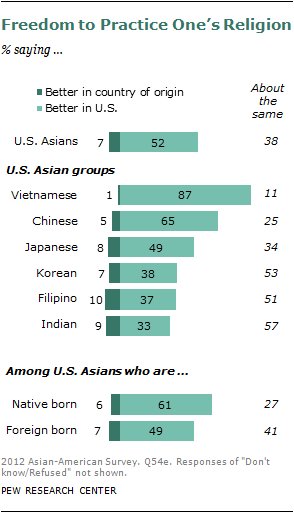
Once again, Vietnamese Americans are the most likely to state that the U.S. offers more freedoms than their country of origin (87% do). Some 65% of Chinese Americans say the same. Korean, Filipino and Indian Americans are the least likely to say that religious freedoms are better in the U.S. than in their country of origin. Among Korean Americans, this share is 38%; it is 37% for Filipino Americans, and 33% for Indian Americans. At least half of respondents from each of these groups state that religious freedoms are about the same in the U.S. and their country of origin.
As is the case with political freedoms, the native born are more likely than the foreign born to say that religious freedoms are better in the U.S. than in their country of origin. Some 61% of Asian Americans born in the U.S. say as much, compared with about half (49%) of the foreign born.
Perceptions of religious freedom in the U.S. versus the country of origin are also associated with religious affiliation. This is likely due, in part, to the fact that religious affiliation is linked to Asian-American country of origin subgroup. For instance, the plurality (38%) of Asian-American Buddhists are Vietnamese Americans. And like Vietnamese Americans, Buddhists in the survey are very likely to say that religious freedoms are better in the U.S. than in their country of origin (63% say so). Some 59% of Asian Americans who are unaffiliated with a certain religion—about half of whom are Chinese Americans—state that the U.S. has more religious freedoms than their country of origin. Some 55% of Protestant respondents agree that religious freedoms are better in the U.S. than in their home country. Almost half (48%) of Catholic respondents, 52% of whom are Filipino Americans, perceive religious freedoms as better in the U.S. than in their country of origin. Another 42% of Catholics think religious freedoms are similar in both the U.S. and their country of origin. And Hindu respondents, the vast majority of whom (93%) are Indian American, are the least likely to say that religious freedom is better in the U.S. than in their country of origin (26% do); this tracks closely with Indian-American opinion.
Moral Values and the Strength of Family Ties
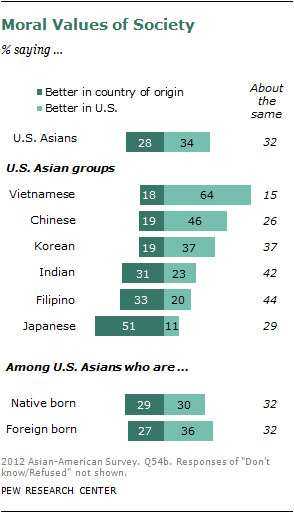
When it comes to evaluating moral values, respondents are fairly evenly split as to whether they are better, worse, or the same in the U.S. versus their country of origin. About one-third (34%) think that the moral values of society are better in the U.S.; 28% think they are better in their country of origin; and 32% think they are about the same in both countries.
Once again Vietnamese Americans stand out, this time as the only subgroup in which a clear majority (64%) perceives moral values as better in the U.S. than in their country of origin. At the other end of the spectrum, only 11% of Japanese Americans feel this way, and about half (51%) perceive moral values as better in Japan. An additional 29% think moral values are similar in both places. Sizable minorities of Filipino Americans (33%) and Indian Americans (31%) also think that moral values are better in their country of origin, though for both groups large minorities (44% for Filipino Americans, 42% for Indian Americans) perceive moral values as similar in their country of origin and the U.S.
Foreign-born Asian Americans are somewhat more likely to regard moral values as better in the U.S. than their country of origin. Some 36% say as much, compared with 30% of native-born Asian Americans.
Hispanic Americans are more likely than Asian Americans to perceive the U.S. as offering better moral values than their country of origin. While 34% of Asian Americans say as much, for Hispanics, this share rises to 44%. Some 21% of Hispanics state that moral values are better in their home country, compared with 28% of Asian Americans.
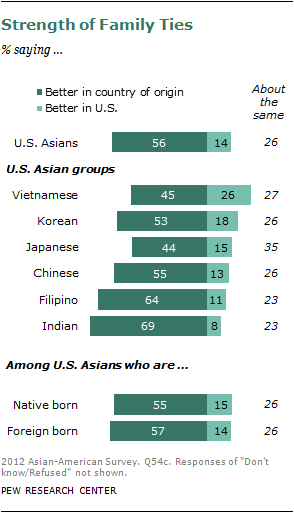
Of all the items that Asian-American respondents were asked about, it is in regard to the strength of family ties that they most favor their country of origin. More than half (56%) report that the strength of ties is better in their country of origin; this is hardly surprising, given that the majority (59%) of respondents still have close family members living there. About one-fourth (26%) feel that the strength of family ties is the same in both places, and only 14% report that the strength of ties is better in the U.S.
This is the only measure for which the plurality of Vietnamese Americans do not favor the U.S. Instead, some 45% state that the strength of family ties is better in Vietnam and 26% say it is better in the U.S. About one-fourth (27%) say the strength of ties is similar in both places. At the other end of the spectrum, only 8% of Indian Americans state that the U.S. is better for the strength of family ties, while 69% consider India better in that regard. Filipino Americans present similarly, with 11% perceiving the strength of family ties as better in the U.S. than the Philippines and 64% perceiving family ties as better in the Philippines.
There are no differences by nativity on this measure.
U.S. Hispanics are far more likely than their Asian-American counterparts to state that the U.S. is better in terms of the strength of family ties than their country of origin. While only 14% of Asian Americans agree with this statement, fully one-third (33%) of Hispanics do. And conversely, while over half (56%) of Asian Americans consider the strength of family ties to be better in their country of origin, this share is 39% for Hispanic Americans. The difference in response by these two groups likely reflects, in part, the fact that Hispanics have a more established history in the U.S. and include a lower share (37%) of foreign-born respondents. In contrast, Asian Americans are predominantly immigrants (59%).
Conditions for Raising Children
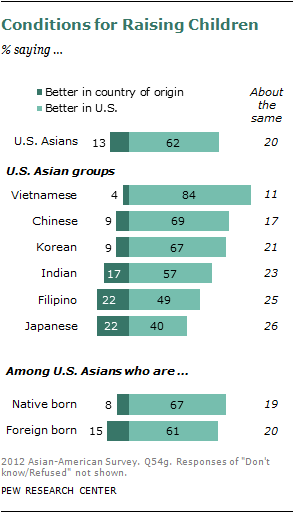
Despite some ambivalence about the U.S. context in terms of morals and family ties, the majority (62%) of Asian Americans consider the conditions for raising children to be better in the U.S. than in their country of origin. One-fifth (20%) say that conditions for raising children are similar in both places, while a smaller share—13%—thinks that conditions are better in their country of origin.
Vietnamese Americans are the most likely to state that the U.S. offers a better context to raise children than their country of origin. Some 84% say as much. The plurality (40%) of Japanese Americans perceive the U.S. as offering better conditions for raising children, but sizable minorities think that Japan provides a better environment for this (22%) or that the conditions are similar in the two countries (26%).
Native-born Asian Americans are particularly upbeat about the prospect of raising children in the U.S. Two-thirds (67%) feel that conditions are better in the United States than in their country of origin. Even among the foreign born, though, a majority (61%) perceives the context for raising children as better in the U.S. than in their home country. Among Filipino immigrants, this number falls to 37%, while 80% of native-born Filipino Americans are relatively upbeat about raising children in the U.S.
Hispanic Americans are even more positive than Asian Americans about the prospect of raising children in the U.S. While 62% of Asian Americans think the U.S. offers a better context than their country of origin for raising children, this share rises to 72% among Hispanics living in the U.S.
Treatment of the Poor
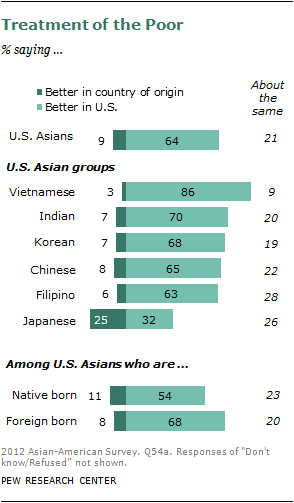
In terms of treatment of the poor, almost two-thirds (64%) of Asian Americans say that the situation is better in the U.S. than in their country of origin. About one-fifth (21%) perceive the treatment of the poor as similar in the U.S. and in their country of origin, and just 9% believe that treatment of the poor is better in their country of origin.
Once again, Vietnamese Americans are especially likely to perceive the U.S. more favorably than their country of origin, with 86% stating that the poor are treated better in the United States. In contrast, about one-third (32%) of Japanese Americans think that the poor are treated better in the U.S. than in Japan, one-fourth (25%) think they are treated better in Japan, and about one-fourth (26%) think they are treated equally in both places. The predominance of native-born Japanese Americans is likely contributing to their divergent views on how the U.S. compares to their country of origin.
There are nativity differences on this measure, with 68% of the foreign born agreeing that the U.S. treats its poor better than their countries of origin do. In comparison, 54% of native-born Asian Americans say the same.
Hispanics are somewhat more positive than Asian Americans about the treatment of the poor in the U.S. versus their country of origin. Fully 69% of Hispanics state that treatment of the poor is better in the U.S.
Which Country Is the Rising Global Economic Power?
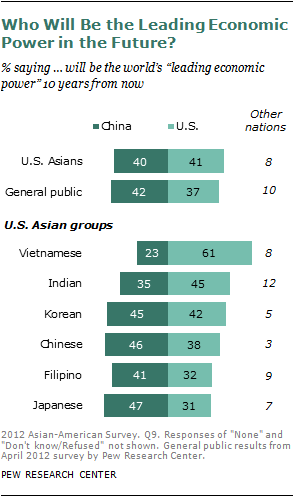
The survey also asked respondents who they think will be the world’s leading economic power a decade from now. About four-in-ten (40%) Asian Americans say China will be the world’s leading economic power 10 years in the future, while 41% say it will be the U.S. and 8% name some other country or economic power (such as the European Union, Germany, India, Japan and South Korea).
Respondents from most subgroups are fairly evenly split on whether they foresee China or the U.S. as leading the world’s economy a decade from now. The exceptions are Japanese Americans and Vietnamese Americans. Japanese Americans are more likely to see China as the world’s future economic power (47% say China, 31% say the U.S.), while Vietnamese Americans are more likely to hold the opposite opinion. Fully 61% expect that the world’s leading economic power in the coming decade will be the U.S., while 23% expect that it will be China.
There are no notable nativity differences on this measure. Native-born Asian Americans are more likely to view China as the world’s future economic power (46% say so), while the largest share (44%) of the foreign born expect the U.S. to be the world’s economic power 10 years from now. However, Chinese-American immigrants are more likely than those born in the U.S. to state that the U.S. will be the world’s leading economic power a decade from now (42% versus 27%). This pattern holds for Korean Americans and Vietnamese Americans, as well.
The judgments of the general public of the United States about the world’s leading economic power in 10 years are similar to those of Asian Americans. Among the general public, 42% believe China will be the top economic power, 37% say the U.S. and 10% cite other nations.
Do Immigrants Strengthen or Burden the U.S.?
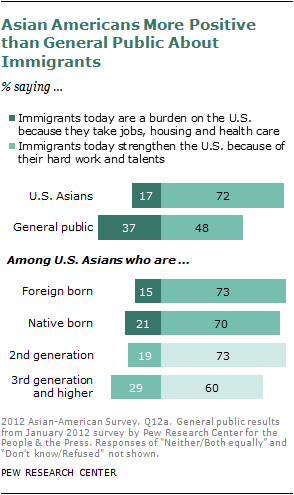
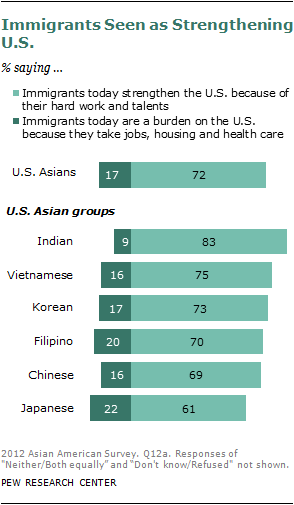
When given two choices for describing the role of immigrants in the U.S., the vast majority of Asian Americans say that immigrants contribute to the U.S., while a much smaller share say immigrants are a drain. Seven-in-ten (72%) agree with the statement that “immigrants today strengthen the U.S. because of their hard work and talents,” while only 17% agree with the statement that “immigrants today are a burden on the U.S. because they take jobs, housing and health care.”68
These opinions are in stark contrast to those of the general population. In a recent Pew Research Center survey, about half (48%) of the U.S. adult population say that immigrants strengthen the U.S., and a somewhat smaller share (37%) agree with the statement that immigrants are a burden.
The gap in attitudes between Asian Americans and the general population is not simply driven by the fact that Asian Americans are far more likely to be foreign born. Both native-born and foreign-born Asian Americans tend to evaluate immigrants as important contributors to the U.S. Among the native born, 70% agree that immigrants strengthen the U.S., as do 73% of the foreign born. A difference of opinion emerges between the second generation (who have at least one immigrant parent) and the third generation (whose parents were born in the U.S.).
While 73% of second-generation respondents see immigrants as strengthening the U.S., among the third generation, this share is 60%.
College graduates and those making $75,000 or more annually are the most likely to perceive immigrants as strengthening, as opposed to burdening, the U.S. More than three-fourths (78%) of respondents with a college degree or more think that immigrants strengthen the U.S. About two-thirds (68%) of those with some college education and 63% of those with a high school diploma or less share this opinion. An almost identical story plays out in terms of income. Nearly eight-in-ten (79%) of those with incomes of $75,000 or more think that immigrants strengthen the U.S., compared with 70% of those with incomes of $30,000 to $74,999. About two-thirds (67%) of respondents earning less than $30,000 annually think that immigrants strengthen the U.S.
In all Asian-American subgroups, the majority agrees that immigrants strengthen the U.S. through their hard work and talents. Indian Americans are especially likely to agree with this statement, with 83% saying as much. Even among Japanese Americans, with their large share of native-born respondents, some 61% agree that immigrants strengthen the U.S.
Asians in the U.S. and in Asia
The Pew Research Center’s Global Attitudes Project has done extensive polling throughout the world, including in some of the nations from which U.S. Asian immigrants have come. The results of this research provide a window into the attitudes and beliefs of Asians who have not emigrated and how they compare with those of Asians living in the U.S.69
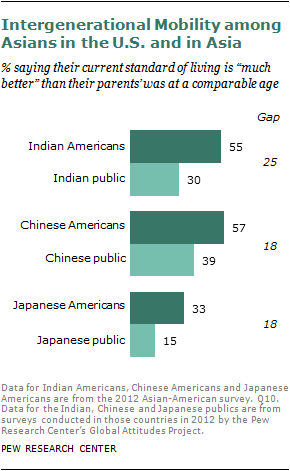
Intergenerational Mobility: Polling in the U.S. and among Asian publics from 2012 suggests that Asian Americans have experienced greater economic mobility than their counterparts still living in their countries of origin. Respondents were asked to compare their current standard of living with that of their parents when they were at a comparable age.70 Among Indian Americans, 55% say their standard of living is much better than their parents’ was at a similar age. The share of adults living in India who say the same is much smaller (30%).
Similarly, while a majority of Chinese Americans (57%) say their standard of living is much better than their parents’ was, only 39% of the Chinese public says the same.71 A similar pattern can be seen when comparing Japanese Americans with Japanese adults in Japan. Japanese Americans are about twice as likely as Japanese adults to say their current standard of living is much better than their parents’ was at a comparable age (33% vs. 15%).
Belief in Hard Work: Asian Americans are strong proponents of hard work. Overall, 69% believe most people who want to get ahead can make it if they’re willing to work hard, while only 27% say hard work and determination are no guarantee of success for most people. In this regard, Asian Americans express a stronger belief in the value of hard work than does the broader American public.
Looking at specific country of origin groups, the shares of Indian Americans, Chinese Americans and Japanese Americans who believe hard work can lead to success are somewhat higher than the shares of Indians, Chinese and Japanese living in those countries who say the same.72 While 59% of Japanese Americans say hard work leads to success, only 40% of Japanese adults living in Japan agree. Among Chinese Americans, 61% say hard work leads to success, while only 45% of Chinese adults in China agree. Strong majorities of Indian Americans and Indian adults in India believe hard work is the key to getting ahead. Nonetheless there is a gap in opinion between the two groups: 75% of Indian Americans vs. 67% of Indian adults in India say hard work leads to success.
Parenting Styles: Whether it’s a myth or a reality, Asian Americans have gained a reputation as strict and demanding parents. Overall, 62% of Asian Americans believe most American parents do not put enough pressure on their children to do well in school. Their views of their own approach to parenting are quite different. Very few Asian Americans (9%) say parents from their country of origin put too little pressure on their children to do well in school. Rather, they believe parents from their country of origin put about the right amount of pressure (49%) or too much pressure (39%) on their children.
The pressure on children to succeed may be even more intense in Asian countries. In 2011, 68% of adults in China said parents in that country put too much pressure on their children to do well in school. This compares with 42% of Chinese Americans who say Chinese-American parents put too much pressure on their children. Similarly, in 2006, 59% of Japanese adults said parents in Japan put too much pressure on their children to do well in school. This compares with 25% of Japanese Americans who say the same this year about Japanese-American parents.
Among Indians and Indian Americans, there is not a significant gap in the share saying that parents put too much pressure on their children to succeed. In 2011, 24% of adults in India said parents in their country do not put enough pressure on their children to do well in school. By contrast, 7% of Indian-American adults say the same about parents from their country of origin group.
Views on Homosexuality: Overall, the American public has become much more accepting of homosexuality in recent years. Currently, among all U.S. adults, 56% say homosexuality should be accepted by society, while 32% say it should be discouraged. The views of Asian Americans are similar: 53% say homosexuality should be accepted by society, and 35% say it should be discouraged.
The balance of opinion on this issue is much different in several large Asian nations. In recent years, strong majorities in South Korea (77% in 2007), China (61% in 2011) and India (58% in 2011) have said homosexuality should be discouraged by society, while fewer than one-in-five in each of those countries said homosexuality should be accepted. The gaps between these Asian publics and their counterparts living in the U.S. are quite wide.73
The Japanese public expresses more tolerant views on homosexuality, and as a result their opinions are more closely aligned with those of Japanese Americans. In 2011, 55% of Japanese adults living in Japan said homosexuality should be accepted. This compares with 68% of Japanese Americans in the 2012 Asian-American survey.
National Conditions: Most Asian immigrants say they came to the U.S. for family reasons, educational opportunities and economic opportunities. Some 43% say they are satisfied with current conditions in the U.S.—a much higher share than the general public (21%).
Looking at Asian publics, satisfaction with national conditions varies widely. Adults living in China are highly satisfied with conditions in that country. In 2012, fully 82% say they are satisfied with the way things are going in their country today. Recent economic growth in China is undoubtedly tied to these high levels of satisfaction. By comparison, Chinese Americans are less satisfied overall with conditions in the U.S. (41% are satisfied with the way things are going in the U.S.).
India, too, has experienced dramatic economic change in recent years. The Indian public is less positive about conditions in India: 38% are now satisfied with the way things are going in their country, and 59% are dissatisfied. Among Indian Americans, 47% are satisfied with conditions in the U.S.
The Japanese public has a more negative view of conditions in their country. Only 20% of Japanese adults now say they are satisfied with the way things are going in Japan. By comparison, Japanese Americans are more satisfied with conditions in the U.S. (36% are satisfied).
The World’s Leading Economic Power: When Asian publics are asked to name the world’s leading economy, the U.S. generally comes out on top. According to the most recent Global Attitudes survey (2012), pluralities in China (48%) and India (37%) say the U.S. is now the world’s leading economic power. The Japanese public is evenly split over which country has the world’s leading economy: 45% point to the U.S., while 43% say China. Americans are similarly divided over which country is the world’s leading economic power. In the same 2012 Pew Global Attitudes survey, 40% of all American adults say the U.S. is the leading economic power, and 41% say China is the leader. The views of the Japanese public and the American public have changed significantly in this regard. In 2008, 52% of Japanese adults said the U.S. was the leading economic power, while only 19% chose China. Among American adults, in 2008, 46% chose the U.S. and 26% chose China.74
In the 2012 Asian-American Survey, Asian Americans were asked to predict which country will be the world’s leading economic power 10 years from now. Overall, they divide about equally between the U.S. (41%) and China (40%). Japanese Americans stand out in this regard: A plurality believes China will be the world’s leading economic power in 10 years. Among Vietnamese Americans a majority believes the U.S. will be dominant.
The World’s Leading Superpower: In 2011, global respondents were also asked about the potential for China to eventually replace the U.S. as the world’s leading superpower. Opinion on this matter is divided across Asian publics. Chinese adults are the most likely to say their country will surpass the U.S. and become the leading superpower (57%). Adults in Japan are more skeptical about China’s future. Among Japanese adults, 25% believe China will eventually replace the U.S. as the world’s leading superpower, while 60% say this will never happen. In India, fully half of respondents had no opinion on this matter. Of those who did express a view, most say that China either would replace the U.S. as the leading superpower or that China had already done so.
This question was not included on the Asian-American survey, so no comparisons are available.


