Over the past few years, Pew Research Center has published several reports examining the characteristics, attitudes and behaviors of U.S. adults who use Twitter.
To produce these reports, we created a representative sample of U.S. adult Twitter users. We did this by asking members of our nationally representative online survey panel, the American Trends Panel, if they use Twitter and if so, whether they would share their Twitter handles with us for research purposes. Having this sample allows us to filter out bots, minors, institutional accounts and international users, and lets us focus on real-life American adults who use the platform. It also allows us to link our respondents’ personal characteristics and attitudes — such as their attitudes toward privacy or their broader news consumption habits — with their actual behaviors on Twitter.
So who are the people who are willing to share their Twitter data for research purposes? Do they differ from Twitter users who aren’t willing to share their handles? Are they representative of all adult Twitter users on our survey panel?
In this post, we’ll discuss how we assembled our collection of U.S. adults’ Twitter handles, the characteristics of those who gave us their usernames, and how well our weighted estimates for these Twitter users compare with our estimates for Twitter users as a whole.
Data collection
Here’s a somewhat simplified version of how we collected Twitter handles in our most recent effort:
At the end of a larger survey conducted in March 2021, we asked our panelists whether they use Twitter. If they said yes, we asked them to provide their Twitter handles for research purposes. (See this companion post for more about the language we used to ask for people’s handles and how that language has changed over time.) We then conducted another survey in May 2021 that was fielded only to the members of our panel who said they use Twitter. This second survey asked about a wide range of Twitter-specific attitudes and behaviors.
Once both surveys were complete, we went back to the initial poll and manually examined the handles of every respondent who volunteered one. We did this to confirm that each handle likely belonged to the panelist who provided it. We removed any handles that were not actually handles (responses such as “no” or “none”), that were inaccessible or did not exist, or that belonged to an institution, company or organization. We also removed a small number of handles that were extremely unlikely to belong to the person who submitted them based on the nature, language or physical location of the account and the personal characteristics of that respondent. Around 6% of our handles, or 63 in total, were deemed invalid and removed for one or more of these reasons.
Overall, 41% of our panel members who use Twitter and took the second survey provided us with a valid, usable handle. The chart below shows the (unweighted) share of Twitter users in different demographic groups who provided a valid handle:
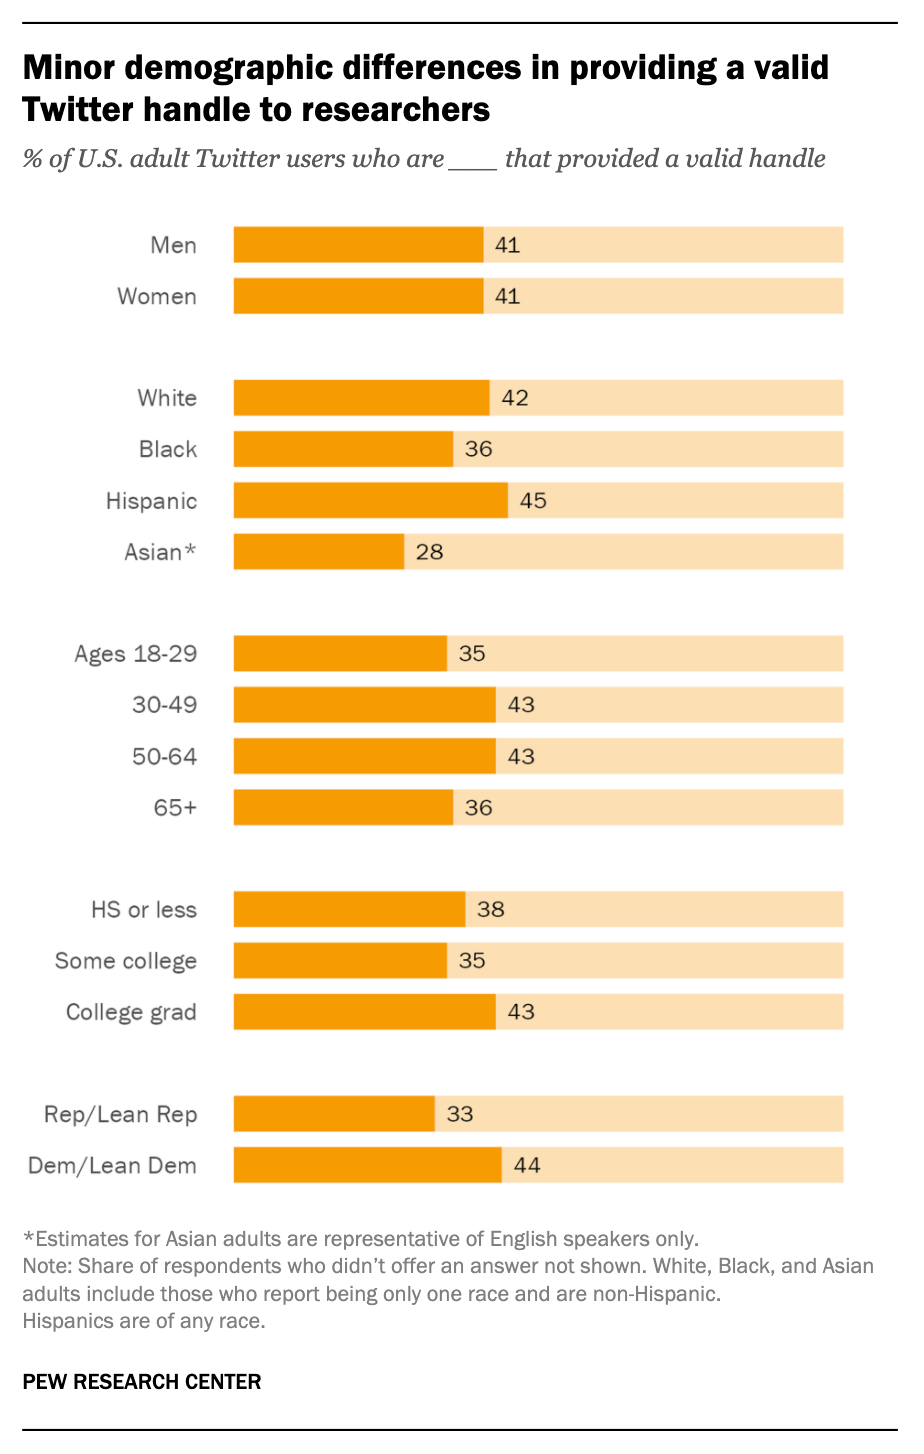
As the chart indicates, certain groups of Twitter users were more likely to provide a valid handle than others. For instance, larger shares of Democrats and Democratic-leaning independents gave handles than Republicans and Republican leaners, as did college graduates relative to those who have not attended college. Larger shares of White and Hispanic respondents gave handles compared with Black and Asian respondents. Consent rates were also relatively low among the oldest (ages 65+) and youngest (18–29) users.
Weighting
To account for differential consent rates across groups, we weighted the “handle giver” population back to our broader sample of adult Twitter users from the March 2021 survey. Specifically, we weighted our final sample of 1,039 U.S. adult Twitter users with valid handles so it matched the broader sample along the following dimensions: gender, age, race, place of birth, years lived in the United States, education, region, party identification, volunteerism, voter registration, metropolitan area and frequency of internet use. (See more information about our weighting process more generally.) This weighting process ensured that our subset of Twitter users with valid handles largely mirrored the broader U.S. adult Twitter user population in terms of its demographics and other basic characteristics that were part of the weighting process itself.
We hoped that our weighted estimates for subgroups would also mirror the broader population of adult Twitter users on factors we did not weight on, such as how often they report using the platform or their described experiences on it. As it turned out, that was largely true: The weighted estimates for our handle givers generally looked similar to those of the total sample of U.S. adult Twitter users. For instance, comparable shares in each group said they have experienced harassing or abusive behavior on the site; use the site too many times to count on a typical day; mostly use Twitter to see what others are saying, rather than express their own views; mostly follow people with similar political beliefs to their own; and get news on the platform.
On other questions, however, there were some differences between those who gave us valid Twitter handles and the broader population of adult Twitter users. The following table compares the weighted shares of those with valid Twitter handles and the total Twitter user sample on some key questions. For reference, it also includes the share of those who did not give us valid Twitter handles:

Even after weighting, we can see some differences on questions that might serve as a proxy for trust in Twitter itself, such as whether Twitter is bad for democracy or whether it is a problem for Twitter to ban users from its platform (as it has done recently for a number of major conservative political figures).
Out of all the questions on the survey, the most notable difference emerged on a question about whether respondents have their Twitter profile set to public or private. Our handle givers indicated quite a bit more often than the overall sample that their profile is set to public so anyone can see it — 64% said this, compared with 53% of all U.S. adult Twitter users and just 48% of those who did not give us a handle. (These figures only reflect the shares who say their handle is set to public, even if that is not actually the case. We have previously found that many users who think their account is private actually have it set to public.)
It’s hard to know exactly why this difference exists, but it may reflect some variation in respondents’ concerns about digital privacy. Past Pew Research Center surveys have documented that Americans have long felt “concerned, confused and lacking control” over their personal information. Digital privacy may simply be an issue that question wording and statistical weighting techniques could not completely address.
When asking respondents for permission to use their Twitter data, it’s important to note that we do try to make clear what information we can and can’t access. If an account is set to private, we are only able to access the very basic metadata that anyone visiting an account can see.
Conclusion
To answer the question we posed at the outset of this post, survey respondents who are willing to provide their Twitter handles do differ somewhat from those who are not willing to share this information. But despite the presence of a group of potentially privacy-conscious users, standard weighting techniques do a fairly good job of aligning the characteristics and attitudes of those who provided their Twitter handles with the larger sample of U.S. adult Twitter users.


