The gaps in the wealth (assets minus debts) of lower-, middle- and upper-income families are much wider than the gaps in income.46 There is one other stark difference: only upper-income families realized notable gains in wealth from 1983 to 2013, the period for which data on wealth are available, while gains in income over that period were felt across all income groups, albeit at different rates. The wealth holdings of lower-income and middle-income families are virtually unchanged, and these families fell further behind upper-income families in the past three decades.
The widening gaps in wealth, measured as the ratios of median wealth, across income tiers are the consequence of the crash in the housing market and the Great Recession of 2007-09. These two closely intertwined events wiped out all of the gains in wealth experienced by lower- and middle-income families from 1983 to 2007.
Wealth and income together provide a more complete financial portrait of U.S. adults. The former is a stock of financial resources accumulated over time, while the latter is an annual inflow of financial means. Some adults, such as retirees, may have low income but high levels of wealth. Meanwhile, younger workers may have a high inflow of income but low levels of wealth.
Unlike income, wealth data are not adjusted for family size because it is difficult to associate a current family size with a stock of wealth. In part, that is because wealth is accumulated and potentially spent over an extended period of time during which family structure may change significantly. It is also typical for at least part of a family’s wealth to be passed on to future generations.
Changes in wealth are measured from 1983 to 2013 using the Survey of Consumer Finances. Because of the way the data are collected and reported, the unit of analysis for wealth is the family, not the household. Families in the Survey of Consumer Finances are divided into three income tiers based on their income level after it has been adjusted for differences in family size.
Because the Survey of Consumer Finances is conducted triennially, the estimates presented in this section are for different time periods than in the analysis of income. The years 1983, 1992, 2001 and 2010 immediately follow recessions or represent the tail ends of recessions. The year 2007 was a business cycle peak, prior to the onset of the Great Recession. Changes in wealth since 2007 reveal the impact of this downturn.
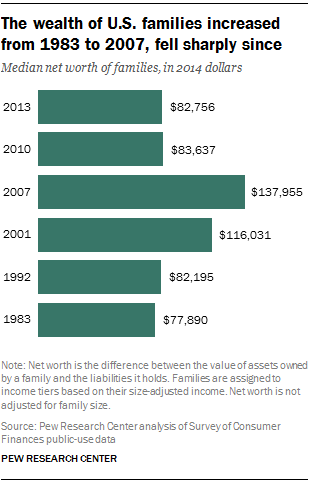
The fortunes of U.S. families overall swung like a yo-yo from 1983 to 2013. The ride up lasted through 2007 as median wealth overall increased to $137,955 from $77,890 in 1983, a gain of 77%. Most of these gains were registered during the record-long economic expansions in the 1990s and the housing market boom that followed.
The wealth of U.S. families plunged as home prices began a rapid descent in 2006. By 2013, overall median wealth had decreased to $82,756, a loss of 40% in the space of just six years. Almost all of this erasure took place from 2007 to 2010, but there was no sign of a recovery from 2010 to 2013. Over the entire span from 1983 to 2013, the median wealth of U.S. families was up only 6%.
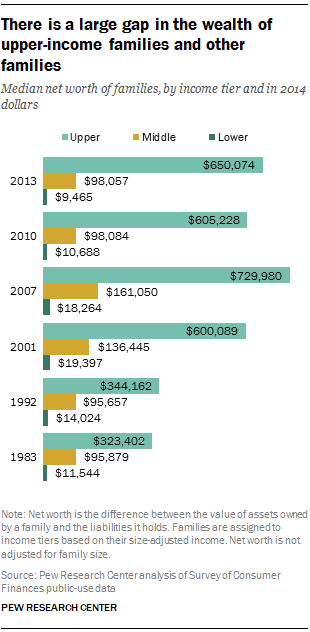
Not surprisingly, the wealth of a family is related to its income. In 1983, the median wealth of middle-income families was $95,879. This was much higher than the $11,544 wealth of lower-income families, but it was far less than the $323,402 wealth of upper-income families. Thus, in 1983, upper-income families had nearly 30 times as much wealth as lower-income families and about three times as much wealth as middle-income families.
The wealth gaps across families in the three income tiers widened greatly from 1983 to 2013. The wealth of lower-income families in 2013 was $9,465 – 18% less than they had in 1983. The wealth of middle-income families was essentially unchanged, rising only 2% to $98,057. However, the wealth of upper-income families doubled to $650,074 in 2013. Thus, in 2013, upper-income families had almost 70 times as much wealth as lower-income families and nearly seven times as much as middle-income families.
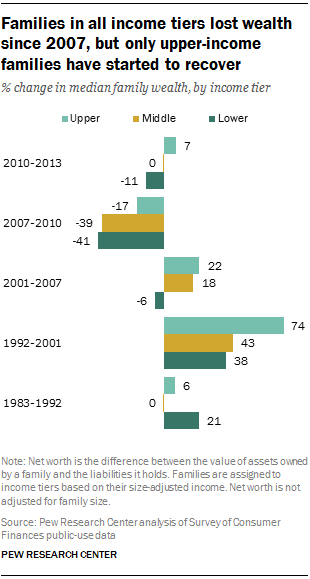
The increase in wealth gaps across income tiers occurred after an initial period of gains for lower-income families. From 1983 to 1992, the wealth of lower-income families increased from $11,544 to $14,024, or 21%. The median wealth of middle-income families was unchanged at around $96,000 in this period. Moreover, the gain for upper-income families was modest as their wealth increased 6%, to $344,162 in 1992.
A period of prosperity ruled from 1992 to 2001 as the wealth of all families rose sharply. For middle-income families, median wealth increased by 43%, from $95,657 to $136,445. Lower-income families experienced similar gains as their median wealth increased from $14,024 to $19,397, a boost of 38%. But gains for upper-income families were much sharper as their wealth almost doubled, from $344,162 in 1992 to $600,089 in 2001.
Lower- and middle-income families have continued to fall behind upper-income families in the 21st century. Heading into the Great Recession, lower-income families lost 6% of their wealth, edging down from $19,397 in 2001 to $18,264 in 2007. Middle-income families strengthened their position, raising their wealth by 18%, to $161,050 in 2007. Upper-income families fared the best, as their median wealth increased by 22%, to $729,980 in 2007.
The Great Recession had a negative impact on all families, with the greatest damage inflicted upon lower- and middle-income families. From 2007 to 2010, median wealth fell to $10,688 for lower-income families, to $98,084 for middle-income families, and to $605,228 for upper-income families. In percentage terms, these represented losses of 41%, 39% and 17%, respectively. Once again, upper-income families stretched their advantage, this time by losing proportionately less than other families.
The harmful effects of the Great Recession are showing signs of dissipating, but the clock is far from being rewound completely. Lower-income families continued to experience losses from 2010 to 2013 as their median wealth slipped an additional 11%. The wealth of middle-income families held steady, at about $98,000. Meanwhile, upper-income families stitched together gains in this period as their wealth rose to $650,074 in 2013, an increase of 7%.
Assets owned by lower-, middle- and upper-income families
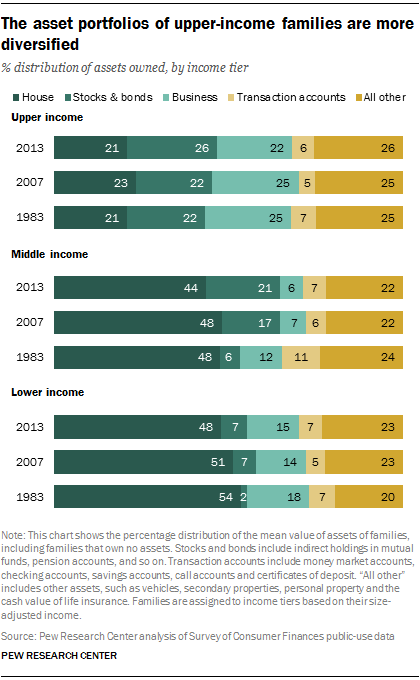
Differences in the types of assets owned by families in the three income tiers likely contributed to the differences in the recent ups and downs of their respective portfolios. An owned home is a sizable asset for most American families.47 But while a home is the single most important asset of lower- and middle-income families, upper-income families have a wider variety of assets. For upper-income families, stocks and bonds and business assets are equally important.
In 2007 and 2013, the equity held in an owned home accounted for about 45% to 50% of the total mean value of assets owned by lower- and middle-income families.48 Stocks and bonds account for about 20% of the total assets of middle-income families but for less than 10% of the assets of lower-income families. Equity in an owned business is more important to lower-income families than to middle-income families, by a factor of about 2-to-1. For both income tiers, transaction accounts and other assets, such as vehicles and other personal property, account for about 30% of assets.
For upper-income families, an owned home represents only about 20% of the total value of assets. Stocks and bonds and business assets each account for 20% to 25% of total assets for these families, and other assets, including transaction accounts, make up an additional 30% or so. It is likely that the greater diversity of assets owned by these families is in itself a result of the greater financial means at their disposal.
The distribution of assets held by American families did not change much from 1983 to 2013. Stocks and bonds gained more importance in the portfolios of lower- and middle-income families from 1983 to 2001 as defined contribution pension plans, such as 401(k) plans, became more prevalent.
The greater reliance on home equity as a source of wealth proved to be detrimental to the financial health of lower- and middle-income families in the 21st century. The most significant economic events in this century have been the crash in the housing market in 2006, a meltdown in the financial markets in 2007-08, and the Great Recession of 2007-09.49
From December 2007 to December 2010, the Standard & Poor’s 500 index fell 14%, and the Case-Shiller national home price index declined by 19%. Thus, as noted, families in all income tiers experienced significant losses in wealth.
In the post-Great Recession period, the stock market recovered more quickly than the housing market. The S&P 500 index rose 47% from December 2010 to December 2013 compared with a rise of 13% in the Case-Shiller national home price index. Overall, these trends in asset values favored families who owned relatively more financial assets than those who owned relatively more housing. Thus, during the course of the latest economic downturn and recovery, the wealth gap between upper-income families and other families grew.
Assets and debts
A family’s wealth, or net worth, is the difference between the value of its assets and the value of its liabilities. Thus, in addition to asset prices, the amount of debt taken on by a family plays a key role in determining its net worth. Although the absolute value of assets rose more than the absolute level of debt in the years leading up to the Great Recession, the rate of growth typically was faster for debt – leaving families vulnerable when the economy weakened.50
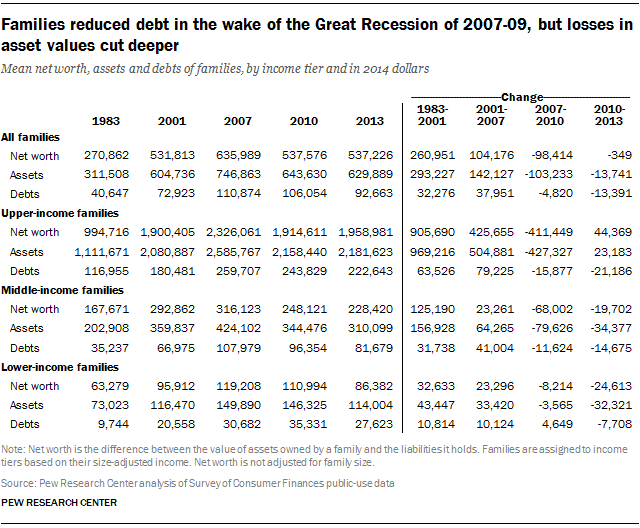
From 1983 to 2001, asset values increased by more than the increase in debt levels for families in all income tiers. Among middle-income families the mean value of assets increased by $156,928, compared with an increase of $31,738 in their debt level. Thus, their mean wealth increased by $125,190 from 1983 to 2001.51 The pattern of asset values increasing more than debt levels also prevailed from 2001 to 2007.
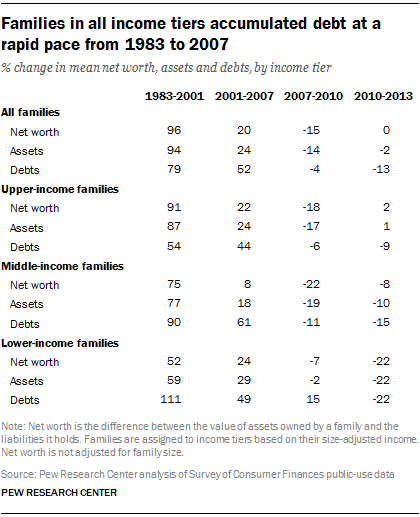
But even as the mean wealth of families was climbing, lower- and middle-income families were accumulating debt at a faster rate than their asset levels were increasing. From 1983 to 2001, the mean level of debt owed by middle-income families increased by 90% and mean asset values increased by 77%. Lower-income families raised their debt level by 111% over the same period, nearly double the increase in their asset values (59%). Only upper-income families experienced a greater increase in the value of their assets (87%) than in their level of debt (54%).
The practice of accumulating debt at a faster rate than the rise in asset values continued from 2001 to 2007. Moreover, it became entrenched among upper-income families as well. Middle-income families raised their debt level by a further 61% from 2001 to 2007, compared with an increase of only 18% in the mean value of their assets. This trend likely placed families in a more vulnerable position prior to the Great Recession than they might have been if the growth in debt and asset values had been more balanced.
Families in all income tiers put the brakes on debt accumulation after the onset of the Great Recession. But these attempts were in vain from 2007 to 2010 as asset values plunged even more. Middle-income families cut their mean debt level by $11,624, or by 11%. But the value of their assets fell by $79,626 (19%). Thus, their mean wealth dropped by $68,002 with the Great Recession. Upper-income families were not immune to the downturn. They reduced their debt burden by 6%, but their asset holdings lost 17% in value.
Lower-income families, with more limited financial resources in general and greater exposure to job losses, were unable to reduce their debt burden from 2007 to 2010. Their level of debt increased 15% in this period. This increase was more modest than in previous periods, but it was damaging in light of a loss of 2% in asset values. Thus, the mean wealth of lower-income families fell by $8,214 with the recession.
Families in all income tiers succeeded in continuing to reduce debt burdens from 2010 to 2013. Middle-income families knocked off $14,675 of their debt, but even that did not keep up with a loss of an additional $34,377 in their asset holdings. Likewise, lower-income families cut their debt by $7,708, but that was insufficient in the face of a loss of $32,321 in asset values. Thus, the mean wealth of lower- and middle-income families dropped again from 2010 to 2013.
Only upper-income families experienced a gain in mean wealth from 2010 to 2013. Their debt level decreased by $21,186, and their asset values increased by $23,183 in this period. Thus, the mean wealth of upper-income families increased $44,369 from 2010 to 2013. But the mean net worth of upper-income families remains less than in 2007, and that is also the situation among middle- and lower-income families.


